Defining a Distribution Environment
2.1 Four Ways to Define the Environment
The first step in designing an effective package system is to determine the severity of the shipping environment. Evaluation of the product’s distribution method can determine which hazards the product will likely come across, as well as the level of intensity of those hazards. Then the package system can be designed accordingly.
Package handling, transportation, and storage can lead to a variety of hazards within the shipping environment, including, but not limited to, vertical drops, horizontal impacts, vehicle vibration, temperature extremes, and compression loads. The method of distribution greatly influences the presence and severity of these hazards, so understanding the shipping environment is essential to designing a package that will effectively protect its product.
There are four different ways of determining the environment through which a product is shipped:
These techniques can be used individually or in conjunction with each other. The advantages and disadvantages of each will be discussed below.
2.1.1 Observation
The most informative method of describing the distribution environment would be to actually follow a package as it travels through the shipping environment and watch what happens to it. Through the use of human observation, first-hand knowledge of the environment can be obtained. Cameras can provide documented evidence of the hazards that a package encounters. Of course, following a package through its complete travel route can be very time-consuming and expensive. The information acquired will only be relevant to the time the observation was made and will only provide a glimpse of that environment. In addition, the behavior of the handlers may be affected by the presence of the observers, as it is human nature to try to perform better while being watched.
Unless the observation can take place unnoticed, the results may not give a completely accurate description of the shipping environment. This method may work best for an initial assessment of the environment, which can later be correlated with supporting data gained from other types of measurement. It may also work well for simple and/or controlled environments that only utilize one or two different modes of distribution.
2.1.2 Damage Claims
Some hazards in a distribution environment go unnoticed until they cause damage to products with insufficient protection. A review of damage reports, which can be obtained from carrier logs, customer complaints, or shipping department personnel, can provide a better understanding of the hazards encountered in a shipping environment. These reports can be used as documented evidence and can indicate how much money is lost due to damage in transit. It may be possible to characterize the type of damage, as well as the geographical location where the damage took place.
However, damage reports do not always contain specific information on the type or extent of damage that occurred. Sometimes damage is incorrectly blamed on insufficient packaging, when in fact the product itself was defective before shipping or the package was grossly mishandled during shipment. Faulty products are often incorrectly packaged for return, resulting in damage during shipping that is unrelated to the original problem or could even compound it. This often causes damage reports to be misleading. Furthermore, not all damage is reported, since sometimes losses are absorbed rather than claimed, making accurate information hard to obtain.
It can be costly to wait for damage to be reported before trying to determine its cause. This method is most effective when investigating damage that occurs to new products and when trying to improve existing package systems.
2.1.3 Literature Search
Perhaps the most widely used approach is to research what others have done. There have been numerous studies performed and an examination of available data can provide a broad understanding of the issues surrounding the measurement of a distribution environment. Research also requires a smaller commitment of time and resources than actually performing the experiments. The difficulty with this approach is that the data can sometimes be outdated and sampling parameters can be unclear or unknown. Conclusions drawn by studies are usually dependent on the author’s perspective and selective data may have been used. Also, the data may not be relevant to the shipping environment in question and some variables may not have been fully addressed. In general, however, this approach has provided the guidelines and rules of thumb used in today’s package design work.
2.1.4 Direct Measurement
The best substitute for actual observation of the environment a package travels through is the use of a recording device to monitor the package and/or vehicle during shipment. The measurement device can record the events that happen throughout the trip without influencing the package’s treatment, since they are usually concealed inside the package. They can be calibrated in the lab before use to test for accuracy, and a correction factor can be established if necessary. Many devices can collect many types of measurements at the same time, thereby utilizing the full capacity of limited resources. Provided the same route is measured enough times using the same equipment and protocol, some sort of statistically valid information can be obtained to help describe that particular channel of distribution. Specific events will obviously vary from trip to trip but a general idea of what to expect will develop.
The disadvantages to this technique are that the equipment can be expensive and the analysis of the data very time-consuming. The analysis is also subject to the limitations of the recording devices. The accuracy of the equipment determines how well the recorded event correlates to the actual event, and sometimes it can be difficult to compare data. Also, there may be such a great number of variables that only a rough estimate of the environment can be made. Although it is not ideal, for now direct measurement may be the best-suited approach for gaining information about a specific distribution channel.
2.2 Inherent Variability of the Environment
The main reason that the distribution environment is difficult to measure stems from its inherent variability. No two packages are treated in the exact same manner, even if they look identical and are shipped through identical routes. Variability is intrinsic to the nature of the way packages are shipped through the environment. Handling, both automated and manual, is usually rushed and becomes even more so near holidays and during peak seasons, such as December. This increases the likelihood of unusually rough handling. Transportation by air, rail, truck, and ship is subject to conditions that are beyond anyone’s control, thus leading to differing treatment of packages depending on the method of distribution. Table 2.2.1 lists the variables, both controllable and uncontrollable, which make measuring a shipping environment such a daunting task.
Table 2.2.1
| CONTROLLABLE | UNCONTROLLABLE |
|
|
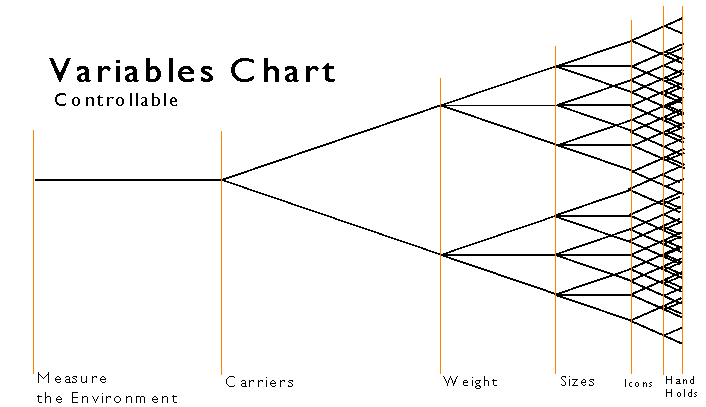
Ignoring the uncontrollable variables, it still leaves many possible outcomes stemming from just a few simple choices. Figure 2.2.1 is a chaos theory chart, which shows how repeatedly making a decision between just two alternatives (shown here by splitting into two different paths) can lead to an enormous amount of outcomes. Consider having two different carriers, three weight ranges and three box sizes, and the option of handling icons and hand holds. This results in 72 different outcomes, shown along the right side of Figure 2.2.2, each of which could involve completely different treatments of a package.
Figure 2.2.1
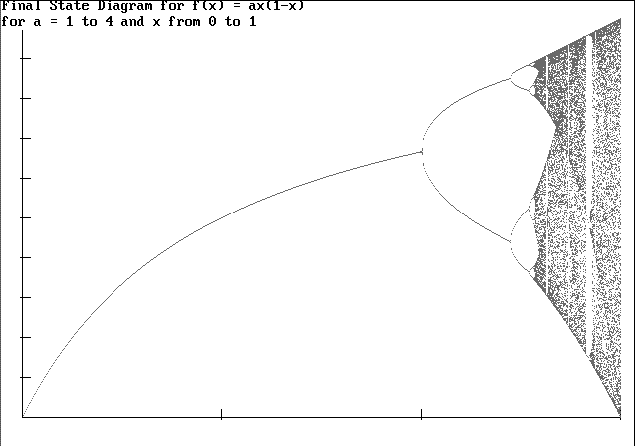
Mapping the change in population after several hundred iterations using
recursion.
x = Population (varies .01 - 1)
a = Population Constant (1 - 4)

Figure 2.2.2

2.3 Past Efforts to Define the Environment
2.3.1 FPL 22
Numerous studies have been conducted attempting to define the distribution environment, but none have had as much impact on the packaging profession as a report written by F. E. Ostrem and W. D. Godshall and published in 1979. The report, called the Forest Products Laboratory General Technical Report FPL 22, An Assessment of the Common Carrier Shipping Environment (commonly referred to as FPL 22), was based on a literature search of information and measurements collected between 1959 and 1977. The information provided by this report was a breakthrough at the time, as it provided packaging professionals with a generalization of the environment, which they could then translate into a basis for laboratory testing and company specification. A majority of today's high tech companies testing requirements have their roots based on this report.
However, the key element that was overlooked by the high tech industry is that the report was based on measurements taken by devices that had a low accuracy and lacked repeatability in the lab. Ostrem and Godshall admit, "the data concerning handling, although not adequate for package design or test purposes, does provide useful information." An example of this is the drop height portion of the report, which was based on using spring mass recording devices such as Impact-O-Graphs and B & K Bump Recorders, which provide very little data and are often inaccurate (Herb Schueneman, 1996).
2.3.2 IBM Study
On November 7, 1989, Mark T. Kerr of IBM concluded a three-year focused study on drop height measurements. The study consisted of 280 shipments of five different size and weight packages through seven different handling points. A total of 17 data recorders (a combination of both Dallas Instruments DHR-1 and Instrumented Sensor Technology (IST) EDR-1) were used in the study. The recorder's analysis algorithm was based on time and velocity change, which also presents certain technical limitations and issues.
Some interesting findings were that no perfect flat drops occurred (although many drops could be considered flat for package testing purposes) and there was no difference between boxes with high-resolution graphics and those without. In addition, there was no significant difference between boxes with or without hand holds.
The study concluded that package graphics, aesthetics, and design had little influence on the treatment the packages received. Human factors in the line layout of the distribution companies’ loading and unloading area actually contributed more to the mishandling and damage. This assumption was later confirmed in another IBM report, "New Approaches to Defining the Distribution Environment," written by Jack N. Daniels and Robert T. Sanders (Distribution Packaging Technology, R. Fiedler, 1995).
The conclusions reached by these studies were useful to the IBM packaging team. However, it was clear that more study of the environment was needed. In an interview with Mark Kerr, he stressed that when attempting to conduct this type of study the following items should be kept in mind (Mark Kerr, 1996):
2.3.3 MSU Consortium
The Consortium of Distribution Packaging is an operational unit within the School of Packaging at Michigan State University. It was established in 1990 to encourage basic and applied research, testing, and service in the area of distribution packaging through the cooperative funding and collective support of industry and academia. Through this joint-action program, research that is beyond the capability and available funding of individual organizations may be undertaken so that techniques and advances thus developed can increase the effectiveness of all member companies. With the participation and support of over ten companies, over 15 studies have been completed.
Some of these studies are listed below, and many are published in various journals and conference proceedings. More information on these reports and the Consortium can be obtained by contacting Dr. S. Paul Singh at Michigan State University.