Introduction
The packaging professional faces the challenge of designing a package system that protects the product adequately, yet is also cost-effective and not excessive. An understanding of the environment in which the product will be shipped is an essential part of this process. Packages are subject to many hazards while being transported from the manufacturer to the end user. These arise from common and necessary distribution activities–automated and manual handling, transportation, and storage—and can easily damage a product that is not packaged properly. Analysis of the distribution environment allows the packaging professional to design the package system with these hazards in mind.
The purpose of this report is to summarize the findings of past and present studies that attempted to gain a better understanding of the shipping environment. The results of one study in particular, headed by the Measurement and Analysis of the Distribution Environment (MADE) task group, will be the focus of this report. The challenges that this study revealed, along with the lessons learned, will be presented. Recommendations for repeating or continuing this study will be given, as well as points to consider when trying to analyze the environment. This report will focus on the U.S. environment only, although discussion of European and Asian environments can be found in Appendix A.
Packaging professionals work to design and update package systems constantly, yet there is still no clear understanding of the environment through which the packages travel. Most standards and test protocols are based on information gained 20 years ago, from studies done with inaccurate equipment in a completely different environment than the one that exists today. Increased carrier business has led to changing conditions in the shipping environment over the years.
According to some estimates, the packaging industry has grown to more than $100 billion in the U.S. and $500 billion worldwide. This figure includes packaging equipment, materials, and labor. About a third of the costs are associated with transport packaging, the other two-thirds are for consumer packaging (A. McKinlay, 1999; W. Pflaum, 1999). The small parcel delivery business, which started in the early twentieth century with United Parcel Service and blossomed in the 1970s with the introduction of worldwide service and the birth of other companies, such as Federal Express, Airborne Express, and DHL Worldwide Express, has expanded tremendously over the last 50 years. Today, express carriers each deliver millions of packages a day and continue to grow, working to improve the speed, extent, and accuracy with which they operate. Package handlers at the central hubs unload, sort, and load hundreds of thousands of packages in a matter of hours, and most drivers deliver hundreds of packages each working day (UPS web site).
Combining express carriers with other forms of transportation modes (rail, sea cargo, LTL), which is something most companies do, increases the potential for mishandled and damaged products.
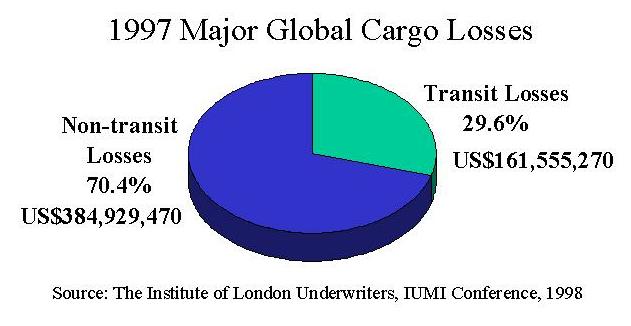
According to the Institute of London Underwriters, worldwide cargo losses from "damage in transit" in 1997 were 3.8% or U.S.$6.2 million, as seen in Table 1 below (IUMI Conference, 1998). The actual proportions of loss are reflected in the pie charts in Figure 1.1. The charts in Figure 1.2 demonstrate that although the heaviest losses to cargo in transit are overwhelmingly the result of accidents to the carrying vessel or other conveyance, most loss does not actually occur as a result of accidents related to the transit. The largest part of non-transit losses, accounting for U.S.$228 million, is related to product damage in warehouse incidents. Thus the importance of understanding the shipping environment becomes evident.
Figure 1.1
Figure 1.2
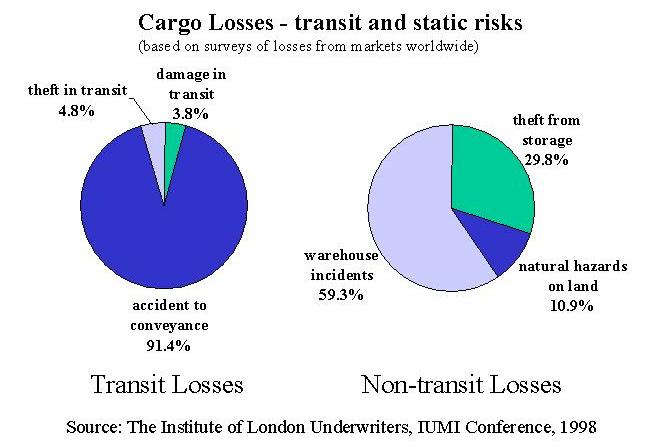
Table 1
Transit Losses |
Non-transit Losses |
|||
| Accident to Conveyances | $147,600,000 |
Warehouse Incident | $228,300,000 |
|
| Theft in transit | $7,700,000 |
Theft from Storage | $114,700,000 |
|
| Damage in transit | $6,200,000 |
Natural Hazards on land | $41,900,000 |
|
$161,500,000 |
$384,900,000 |
|||