MADE Study
The Measurement and Analysis of the Distribution Environment (MADE) task group was established under P2C2 (Protective Packaging of Computer Components), a subcommittee of the Institute of Packaging Professionals (IoPP), in 1991. However, lack of leadership and member activity stalled the group until August 1996, when a new committee, headed by Paul Russell of Hewlett-Packard Company, was formed. Made up mostly of people from high tech industry, the MADE task group consists of almost 75 companies and organizations that have pooled their resources and dedicated time, money, and equipment. The group’s mission is to obtain a better understanding of the distribution environment and share that knowledge with others. To make the study manageable, the domestic small parcel express environment was chosen as the "environment" to be examined. Through the collaboration of packaging manufacturers, packaging users, transport companies, equipment manufacturers, testing laboratories, and consulting firms, MADE hopes to support and encourage transport environment measurement and access, develop data collection and format guidelines, allow multi-media data access, and interface with constituents.
Table 3.1 MADE Members
| 3 Com Corp. | 3M Packaging Systems | Amdahl |
| AMP Inc. | Amtech Systems Corp. | Apple Computer Inc. |
| Applied Materials | AST Computer | Cal Poly State Univ. |
| CargoPRO Services, Inc. | Cisco Systems | Clarion |
| Compaq Computer Corp. | Consolidated Freightways | Dallas Instruments Division |
| Data General Corp. | Dell Computer Corp. | Dennis Young & Assoc. |
| Digital Equipment Corp. | Dow Chemical | Dow Plastics |
| Eastman Kodak Co. | Emery Worldwide | Equipment Reliability Institute |
| Federal Express Corp. | Frigidaire Home Products | Hewlett-Packard Co. |
| Hubbell Lighting Inc. | IBM | Industrial Boxboard Corp. |
| Inhale Therapeutic Systems | Institute of Packaging Professionals (IoPP) | Instrumented Sensor Technology (IST) |
| Intel | International Safe Transit Assoc. (ISTA) | Kohler Co. |
| Lam Research | Lansmont Corp. | Lexmark International |
| Lucent Technologies | McNeil Consumer Products Co. | Michigan State Univ. |
| Micron Electronics, Inc. | National Semiconductor | National Electronic Distributors Association (NEDA) |
| Oregon State Univ. | Packforsk | Quantum |
| Republic Packaging Corp. | RW James Packaging Corp. | Sage Technologies |
| San Jose State University | Seagate | Sealed Air Corp. |
| Shiva Europe Ltd | Silicon Graphics Computer Systems | Sony Corporation of America |
| Sun Microsystems | Tektronix Inc. | Tenneco Packaging |
| Teradyne Connection Systems | Tharco | Thomson Consumer Electronics |
| Unisys | United Parcel Service | University of Nebraska |
| US Postal Service | Ventritex | Watkins-Johnson Co. |
| Westpak, Inc. | William-Sonoma, Inc. | Xerox Corporation |
| Zellerbach | Zenith Electronics |
3.1 Alpha Phase
This phase was performed with the objective of establishing and validating guidelines for data collection and analysis. It was not meant to represent a comprehensive assessment of the environment, but simply to serve as a pilot to demonstrate the process and feasibility of the project. Eight round-trip shipments were measured for impacts and temperature using self-contained data recorders from Instrumented Sensor Technology (IST) and Lansmont. Shipments via United Parcel Service and Federal Express covered distances across the U.S., between companies on the west and the east coasts. Three recording units—two to measure shock and temperature and one to measure only temperature—were hard mounted on wood blocks and surrounded by foam. The total dummy package, which simulated a typical PC shipment, was designed to weigh 25 lbs. and measured 17" by 15" by 8".
The center of mass of the dummy package was as close to the geometric center as possible. Each package contained one IST EDR3 and one Lansmont SAVER portable field data recorder mounted rigidly side by side and oriented in the same xyz axes, along with an Onset "StowAway Tidbit" temperature logger. The wood structure containing the recorders was cushioned with corner pads and placed in a corrugated fiberboard box to be sent via small parcel, second-day distribution systems. The recording units were set to record the most serious 100 events during the entire trip as well as temperature every 30 minutes. Before shipment, the entire assembly was subjected to a drop height calibration by performing free fall tests from 12, 24, 36, and 48 inches on faces, edges, and corners of the package, and comparing the readings with the actual drops. Dropping the package onto both hard and soft surfaces and also correlating the peak heights recorded for tosses provided further calibration. In situations when a unit reported an event with less than 95% accuracy (that is, if the deviation from the true height was more than 5%), a correction factor was established to adjust the results obtained from the field. All three units tested showed satisfactory performance for phase alpha.
The information regarding dummy package specifications and equipment configuration was documented on a given form for each shipment. This form, which can be found at the end of the test plan in Appendix D, included both recorders’ serial numbers and the dummy product’s serial number (if applicable). It also contained the trip number; place, date, and time of shipper; as-received condition; date and time of return shipment; and file name (noting the different extension for each recorder). Details of the expected route, actual route (if known), and company’s name, address, and phone number were included in the report, as well as the date, carrier, and carrier’s tracking number. Other items noted were carrier’s label location and weather conditions. This form accompanied the recorder during shipment to aid in data collaboration and recorder return.
Before shipment, the complete dummy package was dropped three times, with a 1-minute lag between drops, from 36 inches on the bottom surface. This was used by the analysis team as a calibration check and a mark for the beginning of the recording. These initial events were eliminated and not used in the analysis of that trip. At the end of each trip, raw data files were sent to San Jose State University (SJSU) for analysis. The software provided by the data recorders’ manufacturers (Lansmont and IST) and their recommended software setup was used. After the initial examination of all data files at SJSU, some differences were noticed in the results. Lansmont and IST agreed to do the analysis of the files separately, therefore the respective raw data files, along with details of the package used, were sent to them.
Some errors occurred in reading or processing files. Two files, one from the EDR3 and one from the SAVER, presented errors and their data could not be analyzed. Out of eight round trips, only six round-trip shipments could be used in this phase. Initially, for each pair of files to be compared, the events that had a drop height above 10 inches were selected and listed for each unit. The event’s date and time were used as a basis for comparison. The clocks disagreed slightly (the EDR3 clock was slightly faster than the SAVER). No study was done to determine which one was more accurate. This issue was important for phase alpha because it was the basis for event comparison, but was not a problem for the beta phase since the recorders were shipped separately. To resolve this discrepancy, other steps were taken to relate events. If an event indicated a height above 10 inches in one unit but not in the other, a matching event, based on time, was searched for in the other unit. However, these corresponding events were often less than 10 inches or in some cases were not even recorded.
Most events observed were not free fall drops. They were impacts, in basically all orientations. The highest drop height found in all six round trips was 38.8 inches. In the majority of cases, the SAVER and EDR3 units measured similar acceleration versus time waveforms, having similar peak Gs, durations, and velocity changes. Resultant drop heights were different because the calculation methods used to get from acceleration versus time to the equivalent drop height appeared to be different. Waveform discrepancies can often be explained by the differences in filter frequencies.
Even taking this into account, there was still some disagreement between the results given by the units. Most of these were found to be caused by the fact that the analysis was being performed in different parts of the same event. This occurred because the "window" or time frame that was recorded did not always agree completely between units. Although the units were triggered by the same event, the recorded waveforms started and ended at slightly different times, sometimes missing important parts of an event. This issue was addressed in phase beta by extending the recording window well beyond the triggering time, as well as by minimizing the dead time, which is the time just after one event when the unit does not record the waveform. This can be an important consideration when multiple events happen in rapid succession, often called an "event storm." There were also some events with acceleration versus time differences that simply could not be explained. The percentage of these, however, was small.
Phase alpha revealed many issues regarding data collection and analysis, which were necessary to address before continuing with the beta phase. The discrepancies between the units were a concern, as was the time needed for data analysis. The question of whether the difference between the units was a performance issue or just a software issue was raised. Also, it was suggested that to prevent the need for event-by-event analysis, new methods of examining the data (such as adapting new software, developing additional routines, or finding different setup parameters) should be investigated.
Some modifications, dealing with data format and presentation, were recommended. Some were minor, such as changing the term "shipper" to "sender" on the trip documentation form and including the date and time of turnaround. A more major decision involved the recording unit’s orientation. Units should be positioned in the package according to their designated orientation, no matter what orientation the axes are (the software is set to report impact direction as per the unit’s designated orientation). This was an issue in phase alpha because the units were side by side, but should not be a problem for phase beta.
Decisions about the manner in which to present the results were also made. If a large number of replications of the same trip, package size, etc. are to be conducted, then it was deemed better to present results in a statistical distribution format. If conditions change from trip to trip, it was more appropriate to present actual results (example, events higher than 10 inches, 5 largest drops, etc.). This allows the user to determine what statistical analysis is most appropriate depending on the applications.
3.2 Beta Phase
Whereas phase alpha evaluated existing instrumentation and methods of collecting data, the focus of the beta phase was to actually collect some data, while still refining the collection and analysis process, and develop data archiving and results presentation techniques. Because of economical reasons and in light of the basic similarity between the two data recorders, only one instrument, Lansmont’s SAVER, went into each test box for this phase. The box design was changed slightly from phase alpha to reinforce its structure. Six instrumented boxes were shipped via UPS and FedEx second-day delivery, three round trips for each carrier, on five different routes. Custom analysis techniques were being developed, used, and perfected on the collected data.
The data consisted of tri-axial acceleration profiles experienced by the data recorder for each round trip. Events with acceleration levels less than 5 G were considered to be not important and disregarded. Higher G levels were recorded in 3.6-second windows, including 1.2 seconds prior to the first time 5 G was detected, and each event was identified with a date-time stamp. Temperature and humidity history was recorded every 30 minutes during the entire trip.
The goal of the MADE study is to characterize the shipping environment by describing the hazards experienced by the package. If shock is the main focus, then drop heights need to be calculated. Two different approaches exist to do this. The first is to use real drop heights (RDH), which measure the actual or real heights the package was dropped during shipment. The other method involves calculating the effective drop height (EDH), which is the drop height used in standard drop testing that will result in damaging characteristics similar to the original event.
Real drop heights are found using the zero G channel technique, which determines free fall drop height from the duration of the free fall. The package is subjected to a constant 1G gravitational force as it falls freely toward the ground. Since the data recorder measures both the onset of the free fall state and the time of impact (or deceleration), the distance can be calculated by the equation:
![]()
where h is the drop height distance in inches, g is the acceleration due to gravity (386.4 in/s2), and t is the measured time of the free fall in seconds.
Effective drop height calculation also uses the zero G channel, but it is combined with more sophisticated analysis. The analyst must first look at many lab-recorded signal profiles and form an opinion of what to expect from a known drop. The decision must be made as to whether the real-life event can be represented by a single lab drop or not, and then the partitions between the drops are chosen. For each partition, the impact’s start and stop points are identified. The impact is also identified as either a single or multiple point of contact and if there is a clear zero G signature, its start and end are marked. Then the program separately calculates the area under the positive and negative parts of the signal and takes the bigger one, disregarding the smaller for rebound. The result is somewhat proportional to the energy and total velocity change of the impact, which determines the amount of damage. The program compares the value to the table of calibration drops (extrapolating the middle values) and indicates what the lab drop should have been to produce the same value.
Both of these techniques have advantages and disadvantages. The zero G method to calculate RDH is relatively simple and provides good accuracy, when it is applicable. Results are intuitive and usually not open to misinterpretation or validation of the methods used to obtain them. However, only about 5-10% of smaller and 10-20 % of bigger events are actually "clean" free fall drops qualifying for classic zero G analysis. Another 30-40% are also some kind of drops but can not be classified as free falls, so zero G can not be used effectively. The remaining 50% of events are impacts and complex tumbles, which could be sizeable, but clearly do not have RDH. In order to analyze them, their EDH will have to be determined anyway, creating a statistically separate group of results. Furthermore, lack of information about the type of surface onto which the package lands (i.e. how hard or soft it is) creates uncertainty about direct application of the RDH results to standard drop testing.
When using the EDH method, all events can be considered in the same manner. There is virtually no difference between calculating the EDH of an impact resulting from a package falling to the ground or a diverter arm hitting it. Even the damaging factors resulting from package-restricted motions can, to some degree, be represented by a standard drop. The uncertainty of the characteristics of the real drop surface is automatically accounted for in calibration and does not raise questions on the permissibility of using a standard hard surface during the testing. The zero G method is still applicable in some cases and can be incorporated into the analysis to improve the accuracy. However, no statistically separate groups of results are created, in spite of the fact that some effective drop heights are calculated using zero G.
The disadvantages are that to calculate EDH, pulse velocity change and the coefficients of restitution of the instrumented box and drop surface must be known. As a result, the calculated value will inherit all the uncertainties associated with these factors. Therefore, EDH is defined and calibrated for the instrumented box only. If the structure of the real package is considerably different from the instrumented box, a correction factor must be worked out before the results can be used. This approach also tends to oversimplify all shock events into drops, which may not be desirable. The shock duration and energy content of two events, such as a free fall drop or a diverter arm impact, may be different and therefore have different effects on the package. Despite these limitations, EDH was the technique chosen for the beta phase.
Results of the data analysis were compiled into a database (found in Appendix E) and includes, for each trip of the instrumented box, a table listing:
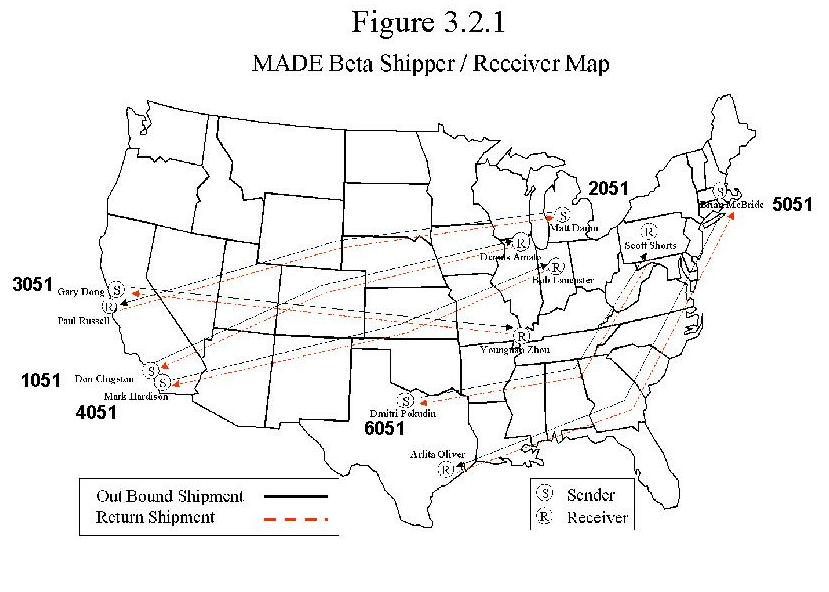
The map in Figure 3.2.1 shows the six different routes studied in the beta phase. The graph displaying the number of impacts by carrier and route (Figure 3.2.2) indicates that there is a slight variation between the carriers depending on the route taken, especially evident for route 1051. Although this could signify differences in their shipping methods, the next graph (Figure 3.2.3) shows the breakdown of drop heights found for that route. There are very few drops over 14 inches, which could mean that the difference in lower level impacts is due to irregularities in the distribution method for that carrier, not significant inequality in package treatment.
Also, the number of impacts for each carrier overall, given in the pie chart in Figure 3.2.4, does not show a large difference between the two studied here.
Figure 3.2.5 shows the distribution of drop heights for both carriers and reveals that neither carrier experienced many high drops. The drop height orientation distribution in Figure 3.2.6 shows that the most impacts occurred on the bottom of the test package, as was expected.
The results of phase beta led to suggestions for the continuation of the project. In order for increased data collection to be economically feasible, the scope of collected and analyzed data must be reduced. Raising the trigger level on the data recorder to ignore activity below 7 G could help accomplish this. Such G levels usually give no more than a 5-8 inch EDH, are most difficult to process, and cause the least reliable results. Filtering this data, however, leads to analysis issues such as data censoring (discussed later in Section 3.4.1) and also may ignore important characteristics of the distribution environment. Another improvement may be to report EDH of 12 inches and higher only. Since smaller drops can not be easily and reliably reproduced in testing, they are not very useful, but take the most processing time. Waveforms could still be kept and reanalyzed later. This, too, has disadvantages, as several successive small impacts may result in as much damage as one larger shock. Small shocks also have an effect on the fatigue of the packaging materials, so information about them could still prove useful.
Other recommendations included guidelines for data collection and analysis. Instrument calibration could be improved by performing it in at least two independent labs, so the results could be compared for accuracy. Procedures needed to calculate the EDH correction factor for real package testing could be determined, as well as the technique to separate round-trip shipments in two one-way stages. Three consecutive flat drops from 36 inches, such as the ones performed at the beginning of the trip, could mark the time of shipment turnaround. Also, it was suggested that working with the carriers to automate the collection of package tracking information and the means of connecting it to the drop data would be helpful.
3.3 Challenges
Throughout the project, challenges arose that needed to be addressed. Some of them involved the process for collecting the data, while others were data analysis issues. Discussion among team members often resolved these issues, although a few remained.
3.3.1 Data Collection
Many factors limited the size and scope of the MADE study. The work undertaken was too much for any one company, so collaboration was essential to the success of the MADE project. This study focused on small parcel express delivery systems, since expanding the scope to include more types of package distribution environments would have required full-time dedication. Resource availability was also a concern, since the data recorders used for this study are costly. Without support and donations from the equipment manufacturers and carriers, this project may very well have stalled. The time it took to actually collect the data was another limiting factor. Shipments often took a week to complete, needing people at both ends of the trip. MADE members, already busy with their own jobs, volunteered their time to act as shippers and receivers. Phase alpha was not finished until early 1998, and the completion of the beta phase was not until early 1999.
Another challenge faced was the decision regarding the number of shipments necessary to obtain statistically significant results. The MADE study used an approach based on package category. For each package size and weight, a confidence interval can be decided upon and the number of trips is chosen to achieve that level. As the number of shipments, and thus the amount of data points, is increased, the confidence intervals tighten. This allows for more certainty in the data and the conclusions drawn from the analysis. Yet, there are often bounds on the amount of data collection that is feasible. For this study, a minimum of 30 trips per path was thought to be optimal for gaining the desired level of confidence; however, resource and time limitations only allowed six shipments each to be completed in the alpha and beta phases.
Accuracy and repeatability are also concerns with the data recorders themselves. Recent studies have shown performance discrepancies may exist between different models of data recorders. One such study, performed by the MADE team to investigate inconsistencies in the alpha phase results, can be found in Appendix F. Data recorders need to be independently evaluated and calibrated prior to data collection so that particular performance issues are noted and considered in the test plan and data evaluation.
3.3.2 Data Evaluation
Obstacles also arose in the data evaluation process. The analysis of the data was found to be very labor-intensive, taking experts employed by the equipment manufacturers an average of eight hours to analyze each file. Each event had to be examined separately, since the software could not always categorize the impacts correctly. Such physical limits as the absence of actual free fall periods for kicks and event overlaps during the event storms prevent any instrument or analysis technique from identifying the drop height of a good portion of events.
3.4 Recommendations
Out of every study come ideas for improvements and future projects. Some of these concern the refinement of the data collection or analysis processes, while others deal with better ways to present the data. This project only included data on shock, but vibration data is also important and should be studied as well.
3.4.1 Collection Process
One of the most important outcomes of the MADE study is the awareness of the need for a standard format for data collection. Many experiments have been performed to measure the distribution environment. However, if other people can not easily use the results, the study is useless. In order to facilitate the comparison of data, guidelines need to be established for data collection. These should include setup parameters for the recording instruments and the dummy packages, equipment calibration techniques, shipment information formats, and data retrieval protocols.
Among the equipment setup concerns is the question of where to set the trigger level, or the threshold below which drops are not recorded. Low level drops (below 10-12 inches) are usually thought to cause little damage to the package or product inside and therefore are not of interest in a majority of distribution environment studies, although ignoring the effects of cumulative small impacts may be inappropriate, as noted above in Section 3.2. Data recorders can be programmed to ignore any events under the predetermined threshold. However, this affects analysis of the data. Any plots or distribution models would miss some of the drops, since events below the threshold level would have been truncated or censored. A histogram or frequency plot of the actual data could be drawn, but the percentiles, and thus the interpretation of the plot, would be thrown off. Instead of the 95th percentile of all drops, only the 95th percentile of all drops over the threshold would be available. Common distributions, such as lognormal or Weibull, could also not be fit properly to the data.
As an alternative, the data recorders could be set to record all events above a much lower level, one that would only distinguish between vibration transients and shocks caused by handling. Since vibration transients are not considered handling events, these can be ignored with no impact on the data analysis. The data recorders would record all shocks and the person conducting the analysis would simply not bother with a detailed examination of the lower level drops. These drops would, however, be counted, and could then be included in the analysis. Certain statistical programs (e.g. Weibull+ + by Reliasoft, SuperSMITH, SAS Analyst, S-PLUS from MathSoft) can handle censored data. These can fit partial data to a lognormal or Weibull distribution, but the number of censored data points must be known. Thus the number of drops below the drop threshold which have been censored must be counted, even if they are ignored in the analysis process.
Handling drop height data is usually analyzed using two types of distributions. One approach involves plotting all observed drops and making a histogram or frequency plot, then modeling a lognormal or Weibull distribution. The other and perhaps more important distribution, however, is the distribution of the worst drop per shipment. Each trip has one worst drop, regardless of the trigger level setting. Including all of these worst drops in a distribution can help choose the maximum drop height to use in laboratory testing. Similarly, a distribution of the second highest drop per shipment could be made, and so on. When creating a distribution of the worst drop per shipment, censored data is not an issue, because every shipment has a worst drop. Perhaps the distribution of the second or third highest drops per shipment would be of interest, in order to have several shipments with these drops below the threshold. If so, the special programs to analyze censored data would be needed.
Another issue to take into consideration is the difference between lab tests and the hazards that products experience in the real environment. Real-world drop heights would rarely, if ever, be as severe as lab test drops from the same height. Drops done in a laboratory are performed with 90 degree vector drops onto a hard, non-yielding surface, so the maximum amount of force possible occurs from that specific drop height. In contrast, drops in a distribution system are usually onto softer surfaces, such as other packages, pallets, and wood truck floors, as well as at a vector other than 90 degrees. In other words, drop heights in the lab can afford to be much lower than drop heights in the real world due to the differences of impact surface and angle of incidence.
A further suggestion to help refine laboratory testing is to try to effectively replicate consistent field damages to current and past products, instead of sending out instrumented dummy packages. The products themselves would then become the field data recorders. Replicating damages in the lab can help set performance baselines for both product and package design of future products. The laboratory attempts to replicate the response, but not necessarily the input found in distribution. Then lab tests could be designed based on the findings. After all, there is no need to test products from 48-inch drop heights if those drops don’t cause damage.
Of course, this approach relies on accurate damage reporting, which in many cases is not available. Many products that are damaged in transit are simply marked "dead on arrival" or DOA, and shipped back with no indication of the type of damage or when it happened. Sometimes the receiver of the package confuses cosmetic damage with product integrity, and there have even been cases where damage was done on purpose to facilitate product return. The amount of damage needed to make any statistically valid conclusions in some instances may be so high that the manufacturer must suffer huge losses before being able to correct the problem.
3.4.2 Analysis Process
There are also important recommendations to improve the data analysis process. Calculating drop heights is usually the major goal of distribution environment studies. However, even with a controlled test using a dummy package equipped with data recorders, there are still some unknown factors. One is the condition of the contact surface onto which the package is dropped. Since lab testing is usually onto hard surfaces, in order to use the data from these field tests effectively, the conditions of average surfaces and hazards of the shipping environment need to be evaluated separately. Once these factors can be corrected for, it should be easier to replicate a drop using a standard lab test onto a solid surface.
As stated before, Effective Drop Height (EDH) can be defined as the height of a solid-surface completely flat, full-length edge or perfect corner drop that results in similar damaging factors experienced by the product as in the original shock event. This causes the EDH of a drop onto a soft surface to be smaller than the true drop height; a drop on a solid hazard with reduced contact area would have a larger EDH. Consequently, standard tests on the solid surface could replicate the conditions inside the real package more closely. Because of the differences between a real package and the instrumented dummy package, identical events experienced by them should theoretically translate into slightly different EDH values. However, knowing the properties of both packages allows a reasonably accurate correction factor to be determined.
Another way to simulate real drops in the lab would be to calculate the drop energy from the original event, using data gathered from the data recorders, and compare it to the energy from a standard lab drop. The energy involved in a drop determines the extent of damage it will inflict on a package. The duration and shock pulse shape are important factors when trying to ascertain the amount of the energy involved. This information could be used to make lab tests more accurately reflect the real shipping environment. To aid in analysis, the waveforms from several types of known hazards could be stored and then used as samples for comparison. This would eliminate the need for each waveform to be individually examined by hand. A software program could even be developed which would allow a complete data file to be analyzed by computer. For each pulse, the program would compare it to a known set of waveforms, and then classify it accordingly.
The current generation of data recorders is not quite adequate for providing this data, which is the most beneficial for a packaging professional. So many exceptions and shock events other than drops exist that recorders can not handle them easily and effectively. More effort needs to be put into developing software that does a better job of analyzing the raw data. The data can be recorded, but analyzing that data and translating it into useful summaries needs improvement.
The unit ratio method is another analysis technique worth considering, found in Singh and Cheema’s article entitled "Measurement and Analysis of the Overnight Small Package Shipping Environment for Federal Express and United Parcel Service" (Journal of Testing and Evaluation, July 1996). This method is used to classify shock events into three categories—free fall vertical drops, lateral kicks, and tosses. It uses two forms of the drop height in its calculation. The first is the zero G drop height (see Section 3.2 of this report), given by:
![]()
where hz is the free fall drop height, t is the free fall time, and g represents the acceleration due to gravity. The other is the equivalent drop height, given by:
where he is the equivalent drop height, D V is the velocity change, e represents the coefficient of restitution, and g is again the acceleration due to gravity. The unit ratio is shown in the following equation:
![]()
A correlation between the unit ratio and the type of shock event was found from lab tests. For a free fall drop, the unit ratio lies between 0.5 and 2.0, while values below 0.5 represent kicks and those above are tosses. This can be used to categorize events based on their calculated drop heights, and involves slightly less work than other methods.
One last consideration, which may or may not be helpful, has to do with package ergonomics. Manual package handling involves lifting, carrying, and other ergonomically stressful tasks, which often lead to the mistreatment of packages. Although most package handling operations are almost fully automated, there is usually still some manual work involved. Whether the package is likely to be dropped can be determined from a simple equation to calculate the ergonomical load of the package (see Appendix G). If it surpasses permissible limits, then the package can be considered hazardous for manual handling and the likelihood of drops will increase. The good and bad ergonomics of a package, such as size, position, and task frequency, in addition to weight, could be evaluated and taken into account during the design stage. The package could then be modified if necessary to improve handling ease. A more ergonomically sound design could prove beneficial in terms of reduced drop height.
3.4.3 Presentation of Data
Not only do guidelines for data collection and analysis need to be established, but a standard for presenting data should also be decided upon. Three basic formats are raw, analytical, and presentation. The raw format consists of the original data files, either sorted or unsorted. This type of format allows post-processing of the data if the user chooses. The only caveat is that the software used for the original file must be compatible with the current version. The analytical format is data presented in tabular form and includes a characterization of each selected data event. It is helpful when designing the presentation format and suitable for data set linkage. Spreadsheets and databases work well for this format. The presentation format summarizes the data and puts it in perspective. It is a high-level view of the information and allows the user to easily draw inferences or generalities. It usually involves a graphic characterization of the data, either a histogram or plot of some sort. All three formats presented together allows the most flexibility for the end user.
The ultimate goal of the MADE study is to develop a worldwide web site that would store all the information learned and make it available to packaging professionals everywhere. The user would identify certain variables of a proposed package and shipping route, such as product weight range, shipping origin and destination, and carrier mode. The site would return a high-level summary report, analyzed from the data stored there. Information about the following parameters could be retrieved from the database:
The user could then refine the inquiry to get more specifics about the information collected and its applicability to the particular product and distribution channel.
This could also be a service offered by the data recorder manufacturers themselves, as part of their value proposition. The manufacturers could redefine protocols for data collection and develop algorithms to analyze the waveforms to match known characteristics. Customers could then upload their own data files to a data warehouse and conduct data mining for the particular information of interest to them. This would facilitate the sharing of information and also help strengthen the manufacturers’ relationship with their customers.