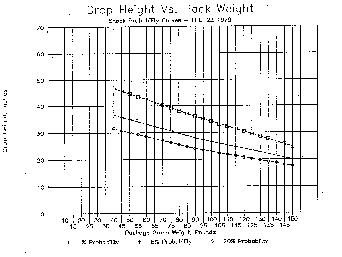
Figure 1 - Forest Products Laboratory General Technical Report FPL 22 (1979)
Figure 2 - IoPP P2C2 study of 19 High Tech Companies (1995)
Paul Russell
Hewlett-Packard Company
Introduction
As always, packaging professionals are interested in how to prevent damage to their products. At the same time, they are also looking for the most effective ways to package, load and secure their shipments in order to reduce costs. Information on distribution environments provides the packaging professional the information with which to make decisions in these areas.
Improvements in distribution equipment, operating procedures, and recording devices over the last several years have resulted in a need for new data to establish or reconfirm shock and vibration environmental profiles of today's distribution systems. However, caution should be expressed before heading out and measuring the environment. Defining environments is not as simple as shipping a few data recorders through a distribution channel. It is a complex, long, drawn out study requiring more resources than typically one company can invest. This paper will present some of the findings of past studies and current industry efforts.
Defining the Shipping Environment
The first step in a "5-Step" or "6-Step" method for designing a package system, is to determine the severity of the environment in which the product will be shipped. The general idea is to evaluate the method of distribution to determine the hazards which are present and the levels at which they are present. These may include such things as accidental drops during handling, vehicle vibration, shock inputs, temperature extremes, humidity levels, and compression loads. Once the method (or methods) of distribution is chosen, there are four ways to define that environment:
1. Observation
2. Damage Claims
3. Literature Search
4. Direct Measurement
It would be nice to follow every package through the distribution environment and observe what actually happens to it. However, many times only the other three approaches are available. This paper briefly discusses the use of the latter two approaches.
Literature Search
The least alluring, but probably the most widely used approach, is to study available data. The difficulty with this approach is that the data is usually outdated, sampling parameters are unclear or unknown, and the data may have been recorded from an environment through which your products will not actually travel. For example: your product may travel second day domestic express and the literature available may only cover Less-Than-Truckload (LTL) environments. In general, however, this approach has provided the guidelines and rules of thumb used in today's package design work.
Direct Measurement
The next best thing to being there is using some sort of recording device to monitor the package and/or the vehicle during shipment. Provided this is done enough times, using the same equipment and protocol, some sort of statistically valid information can be obtained to help describe that particular channel of distribution. The events and uncontrollable variables will obviously occur from trip to trip but a general idea of what to expect will develop. The issue here is that this approach is time consuming, expensive, and is subject to the limitations of the recording devices. Although not ideal, it is the best suited approach for gaining information about a specific distribution channel.
Past Efforts
Ostrem & Godshall - FPL 22
Numerous studies have been conducted attempting to define the distribution environment but none have had as much impact on the packaging profession as a report written by F. E. Ostrem and W. D. Godshall and published in 1979. The report (The Forest Products Laboratory General Technical Report FPL 22, An Assessment of the Common Carrier Shipping Environment) referred to as FPL 22, was based on a literature search of information and measurements collected between 1959 - 1977. The information provided by this report was a break through at the time as it provided packaging professionals with a generalization of the environment which they could then translate into a basis for laboratory testing and company specification (figure 1). A majority of today's high tech companies testing requirements have their roots based on this report (figure 2).
Figure 1 - Forest Products Laboratory General Technical Report FPL 22 (1979)
Figure 2 - IoPP P2C2 study of 19 High Tech Companies (1995)
However, the key element that was overlooked by the high tech industry, is that the report was based on measurements taken by devices that had a low accuracy and lacked repeatability in the lab. Ostrem and Godshall admit, "the data concerning handling, although not adequate for package design or test purposes, does provide useful information." An example of this is the drop height portion of the report which was based on using spring mass recording devices such as Impact-O-Graphs and B & K Bump Reorders which provide very little data and are often inaccurate. (Herb Schueneman, 1996)
IBM Study
On November 7, 1989 Mark T. Kerr of IBM concluded a 3 year focused study on drop height measurements. The study consisted of 280 shipments of 5 different size & weight packages (see table 1) through 7 different handling points. A total of 17 data recorders (a combination of both Dallas Instruments DHR-1 and Instrumented Sensor Technology EDR-1) were used in the study. The recorder's analysis algorithm was based on time and velocity change.
| Package Number | 1 | 2 | 3 | 4 | 5 |
| Weight (LB) | 12 | 24 | 48 | 48 | 54 |
| Size (CU FT) | 1 | 3 | 3 | 5 | 5 |
Some findings from the study are displayed below (figure 3-5).
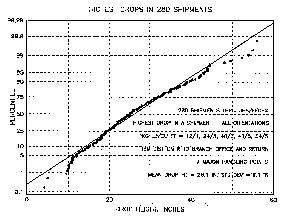
Figure 3 - IBM Highest Drop Analysis
It was concluded that package graphics, aesthetics and design had little influence. It was more a function of human factors in the distribution companies loading/unloading area's line layout that contributed to the mishandling and damage . This assumption was later confirmed in another IBM report New Approaches to Defining the Distribution Environment written by Jack N. Daniels and Robert T. Sanders (Distribution Packaging Technology, Robert M. Fiedler, 1995).
The conclusions reached by these studies were useful to the IBM packaging team. However, it was clear that more study of the environment was needed. In an interview with Mark Kerr, he stressed that when attempting to conduct this type of study the following items should be kept in mind:
- Spend time on calibration of the measurement equipment to test package
- Measurements must be tailored/specific - a great deal of time and effort
- Minimum of 50 shipments per package weight and size are needed for a high confidence level
- Requires 2 1/2 - 3 years work
- Medium weights defy current logic and design specifications
- Real World Drop Height doesn't necessarily go down as weight goes up
MSU Consortium
The Consortium of Distribution Packaging is an operational unit within the School of Packaging at Michigan State University. It was established in 1990 to encourage basic and applied research, testing and service, in the area of distribution packaging through the cooperative funding and collective support of industry and academia. Through this joint action program, research that is beyond the capability and available funding of individual organizations may be undertaken so that techniques and advances thus developed can increase the effectiveness of all member companies. With the participation and support of over ten companies, over 15 studies have been completed. The studies that relate to this paper are listed below:
- Packaging Dynamics in the Overnight Small Parcel Delivery System of Federal Express,
United Parcel Service, and United States Postal Service.
- Dynamic Analysis of Less Than Truckload Shipments
- Measuring the Truck Shipping Environment
- Dynamic Analysis of Trans-Atlantic Ocean Vessels Distribution Environment
- Monitoring Transient Shocks in Rail and Truck Environments
- Comparison Between Commercial Drop Height Recorders
- The UPS Shipping Environment
- Measurement of the UPS Shipping Environment
- Predicting Temperature Variations in Truck Shipments
Only members of the Consortium have access to these studies. More information on these reports and Consortium can be obtained by contacting Dr. S. Paul Singh at Michigan State University.
If we only knew what we know
These are only a few of the numerous public studies that have been conducted. Many more private studies are buried in company or university research libraries or hidden away on some packaging professional's book shelf. However, it can be assumed that even if we did have access to all the studies ever conducted, it would be extremely difficult to analyze them due their differing data collection techniques and analysis. In addition, these studies, while useful for their own purpose, often do not provided enough information to justify existing or to develop new package performance standards. This can be overcome by using agreed upon guidelines for properly collecting, analyzing, and sharing data in a public form. The following section will examine current efforts to characterize the distribution environment.
Current Efforts to Measure and Share Data
About the Distribution Environment
SRETS - Europe
Dr. Thomas Trost of Packforsk (Swedish Packaging Research Institute) is heading up an EU technical committee "Source Reduction by European Testing Schedules" (SRETS). The objective of SRETS is twofold:
1) Gather data from the distribution environment which is up to date and representative of a wide range of products and distribution channels in current use in Europe.
2) Create EN (European Norm) standards to provide uniformity of product and package test methods throughout Europe and prepare testing schedules which are representative of the distribution hazards experienced by packaged products.
The SRETS technical committee hopes that by developing these techniques for normal use in the packaging chain will result in packaging specifications meeting minimum cost and material requirements compatible with current environmental issues and an improved awareness of quality transport according to EN 29 000. They believe this will prevent over testing as well as over packaging. It should also contribute to the reduction of source materials in packaging and ultimately in the packaging waste stream.
The SRETS technical committee's project goals are:
- Collect environmental data
- Prepare an open data base for European testing methods and testing schedules
- Develop methodological strategies to interpret measured data into relevant test programs
- Compare damage caused by simulation in the packaging laboratory with damage incurred in field trials
- Develop standardized test programs according to the scope of CEN (TC 261 SC1/WG4)
Participating companies/institutes on this technical committee are: FhG-ICT (coordinator); Alfa Laval Materials AB; BFSV; Bosch; FhG-IML; Hunting Engineering Ltd; J&B; LNE; Packforsk; Pira International.
Lexmark International
Lexmark's Greg Kolles believes that the distribution environment is an ever-changing industry. Greg has hired Scott E. Wilson, Masters student at Rochester Institute of Technology, to analyze Lexmark's small parcel environment. Scott recently began a program of monitoring small parcel drop heights using Lansmont Saver data acquisition equipment. Currently, the test compares significance between two small parcel carriers, two routes, two size/weight packages, and the use of handholds. The results of this study will be compiled into a thesis. It is hoped it will help support the confidence levels of laboratory package drop testing or be used to create an alternate test specification based on real world events. Scott's thesis will be titled Analysis of the Single Parcel Carrier Distribution Environment for Drop Height Statistical Referencing and Development of Laboratory Test Specifications and should be available in the spring of 1997.
Industry Organizations Team Up
The International Safe Transit Association (ISTA) and the Institute for Packaging Professionals (IoPP) have formed a joint Task Group on Transport Environment Measurement. It is based on open participation from both ISTA member companies and IoPP individual members. The scope of this joint Task Group is establish an open-access storage center for collected data. Their objectives are to:
- Support and encourage transport environment measurement and data access
- Develop collection guidelines
- Develop data format guidelines
- Allow multi-media data access
- Interface with constituents
The Task Group is interested in collecting several categories of information - Dynamic (drop, shock, vibration, and load), Static (temperature, humidity, and atmospheric pressure), and Systematic/non-systematic hazards. The protocol for collecting and reporting this information is the critical link. Without proper guidelines, the data collected would be useless. The joint Task Group is working to develop these Collection Guidelines and Information Formats and the first draft was to be published in December 1996. Tables 2 and 3 show the items being considered by the Task Group.
| Core characterization (min. set) | Sensitive to Design of Experiment/Decision Support |
|---|---|
| Dependent variables - Preferred measurements - Drop height, acceleration, velocity change, temperature - Event characteristics - Frequency range, max. level resolution - Sample rate, measurement time | Independent variables - Preferred and possible list - Package variables - Transport variables - Other variables - Season, preconditions |
| Presentation Format - Graphic characterization - Summarizes data in perspective - Able to draw inferences or generalities - Supports lab specifications - 2 types - Descriptive, and Comparative - Preferred Style - Dynamic - Drop: Drop Height histogram - Shock: Peak G / Velocity change, histograms - Vibration: PSD Spectra with time - Load: Load/time history - Preferred Style - Static - Parameter/time history | Analytical Format - Tabular form - Characterization of each selected data event (individual measurement) - Use to design presentation format - Suitable for data set linkage - Preferred styles - Tabular / Spreadsheet - Rows by events - Columns by variable - Drop Height, Acceleration, Velocity Change, Temperature, Relative Humidity
|
|---|---|
| Raw Format - Original Data files - Sorted or non-sorted - Allows post-processing - Preferred styles - Current version software compatible | Compatibility targets - Presentation & Analytical format - Cross platform compatible - Raw Format - Collection hardware dependent - Maybe analysis hardware exclusive |
| Media Format - Presentation (Hard Copy & FTP) - Analytical (Disk & FTP) - Raw (Disk & FTP) |
Combining the two groups should broaden the ability to collect information from as many sources as possible and develop a centralized storage center for general access. The Joint Task Group is being chaired by Jack Dority, of Lansmont, who is also the IoPP Environmental Measurement Task Group chair and a VP in ISTA. The IoPP Transport Packaging Committee is chaired by Dennis E. Young who is also the Technical Director for ISTA and has been instrumental in the formation of this group.
The Task Group will maintain a liaison with interesting people within ASTM D-10, but not ask them to do any standards activity, just receive information.
More information and current status of the task group can be found at the ISTA Web site located at: http://www.ista.org
P2C2 - MADE task group
The MADE (Measurement and Analysis of Distribution Environments) task group was established under P2C2 (Protective Packaging of Computer Components) in 1991. However, lack of leadership and member activity stalled the group until August 1996 when a new committee and direction was formed. Mainly made up of people from High Tech industry, consisting of 46 companies and organizations (see table 4), the mission of the MADE task group is to obtain a better understanding of their distribution environment and make that information publicly available. Since the "environment" is much too large for an initial study, the task group has broken it down into modules with the US domestic express environments being the first module they plan to study.
| 3 Com Corp. | 3M Masking and Packaging | Amdahl |
| Amtech Systems Corporation | Apple Computer Inc. | AST Computer |
| Cal Poly State Univ. | Cisco Systems | Compaq Computer Corp |
| Consolidated Freightways | Data General Corp. | Dell Computer Corp. |
| Dennis Young & Assoc. | Federal Express Corporation | Hewlett-Packard Company |
| IBM | Industrial Boxboard Corp | Intel |
| IoPP | IST | Lam Research |
| Lansmont Corporation | Lexmark International | National Semiconductor |
| NEDA | Packforsk | Quantum |
| San Jose State University | Seagate | Shiva Europe Ltd |
| Silicon Graphics Computer Systems | Sony Corporation of America | Sun Microsystems |
| Tektronix Inc. | Tenneco Packaging | Teradyne Connection Systems |
| Tharco | Thomson Consumer Electronics | Unisys |
| United Parcel Service | US Postal Service | Ventritex |
| Watkins-Johnson Co. | Westpak | Xerox Corporation |
| Zenith Electronics |
Establishing linkages with the ISTA/IoPP Task Group, the MADE group plans to review, and possibly use, the ISTA/IoPP guidelines when they become available and to share with them the information they collect. However, lacking those guidelines, the MADE task group has formed 5 committees to develop the protocols for a limited study. Those committees and their responsibilities can be seen in Table 5.
| Committee | Administration | Test Plan | Equipment | Statistical | Analysis |
|---|---|---|---|---|---|
| Companies | Hewlett-Packard Lansmont Sun Microsystems Tektronix Inc. | Apple Compaq Computer Dell Computer Hewlett-Packard IST Lansmont Lexmark Sony Sun Microsystems Tektronix Inc. Tharco Thomson Consumer Electronics United Parcel Service Ventritex Xerox | Amtech Systems Apple Dell Computer Federal Express Hewlett-Packard Intel IST Lansmont Sony Watkins-Johnson Co. Westpak
| Apple Federal Express Intel Lansmont | Federal Express Hewlett-Packard IST Lansmont San Jose State Univ. Sony
|
| Responsibilities | Logistics & Process flow | Develop Test Plan | Recorder fixturing Calibration Data transfer Availability | Sample size Variables Confidence level | Data transfer Validity checks Report formats |
MADE Limited Project Study
The current project proposal is to run an alpha test using the protocols defined by the committees. The test will use 15 twenty-five pound packages (of realistic density), each containing two data recorders (one Lansmont and one IST) and ship via 2nd Day Air (Federal Express & UPS) to a main carrier hub which will then re-route them back to the originator for data down load. The type of data that is planned to be recorded and analyzed is:
- Formula for determined average drop height and maximum drop height per shipment
- Drop orientation
- Impacts verses actual drops (can equivalent free fall energy be determined)
- Max., Min., and mean temperature and humidity
- Max. rate of change in temperature and humidity
- Time and date of event
- Location of event (if possible using carrier tracking number and locator service).
It is estimated that a total of 450 shipments will made within a three month window (see table 6 for time line). After the alpha test is completed and analyzed, the MADE task group will make further refinement to the protocols and compare them to what was developed by the Joint ISTA/IoPP Task Group. At that time it will be decided if further study is justifiable.
Table 6 - MADE Time Line
| Period | Activity |
|---|---|
| Sept. to Dec. '96 | Develop Draft Test Plan and Protocol / Evaluate and Calibrate Recorders |
| Jan. to Feb. '97 | Obtain Group Agreement on Test Plan and Protocol |
| Mar. to May '97 | Start Alpha Data Collection / Fine Tune Recorder Parameters |
| Jun. to Aug. '97 | Start Overall Analysis of Data / Fine Tune Test Plan and Protocol |
| Sept. '97 | Present Findings to Group / Decide Future Study (Beta) |
| Oct. to TBD | Start Beta Collection |
The interesting thing about the new MADE task group, its committees, and why they have been able to make such rapid progress, is that it has only held one physical meeting. The rest of the communications and meetings have been conducted via e-mail, worldwide web, and telephone conferences. Current information about the group, test plan drafts, and protocols can be found on their web site located at: http://www.corp.hp.com/publish/talkpkg/made/index.html
Summary
Past and present environmental data collection techniques and reports, while useful for their own purpose, are not providing enough information to justify existing or to develop new package performance standards. Only by properly collecting (using agreed upon guideline), analyzing, and sharing data (in a public form) will there be enough information to start characterizing the distribution environment. Technological advancements will continue to improve the transportation environment and these advancements need to be monitored and documented so packaging performance standards can be refined. Characterizing the transportation environment will not happen over night, but with continued effort and support, the ISTA/IoPP and MADE task group's data collection and centralized storage will make it possible. A glimpse into the future may reveal a worldwide web site that a packaging professional would be able to access this information. The user would identify certain variables of a proposed shipping route and the site would return a high level summary report, analyzed from the data stored there (figure 6). The user could then refine their inquiry to get more specifics about the information collected and its applicability to their particular product and distribution channel. At the rate of advancements in information technology and the combined cooperative industry effort, this possible future may become a reality in the next 3 to 5 years.
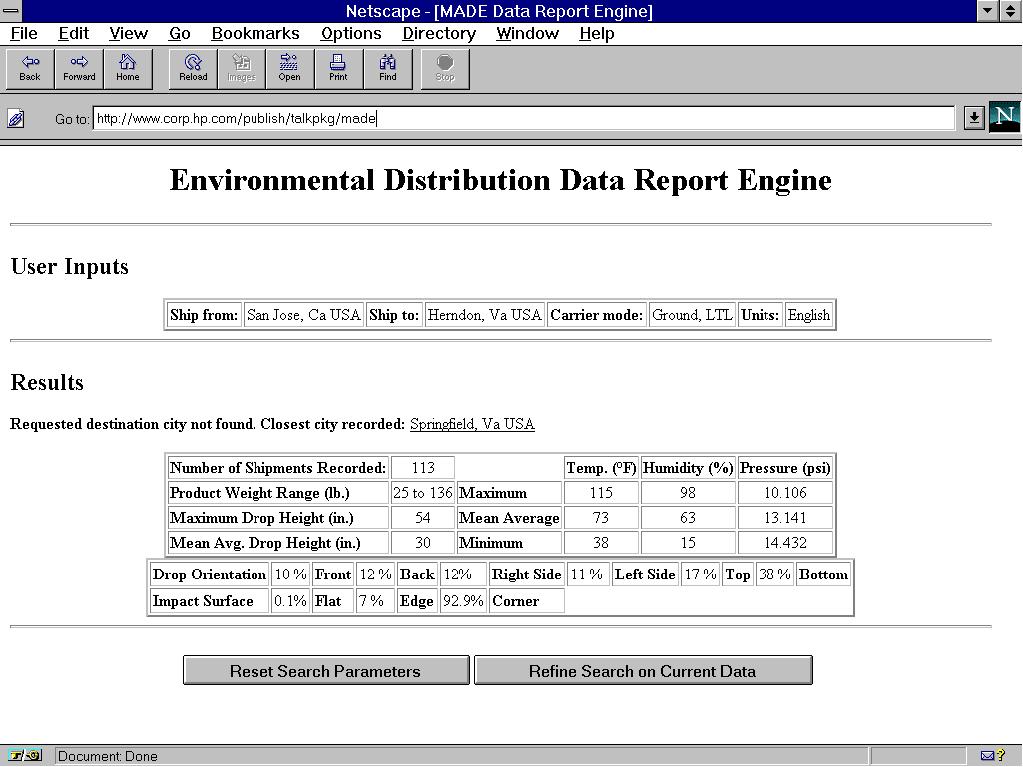
Figure 6 - Data Report Engine
Contacts:
Mark T. Kerr
IBM Corporation, M/S W29/002
3039 Cornwallis Road
Research Tri. Park, NC 27709
Tel: (919) 543-7090
Fax: (919) 543-4253
Robert T. Sanders
IBM Corporation, M/S NJW/Bldg. 002-3
3039 Cornwallis Road
Research Tri. Park, NC 27709
Tel: (919) 543-1260
Fax: (919) 543-4253
Dennis Young
Dennis Young & Assoc.
517 W. Lovett Street, Suite 2
Charlotte, MI 48813
Tel: (517) 543-6234
Fax: (517) 543-6858
E-mail: dyainc@voyager.net
Web: http://www.dyainc.com/dyainc/
Herb Schueneman
WESTPAK, Inc.
134 Martinvale Lane
San Jose, CA 95119
Tel: (408) 224-1300
Fax: (408) 224-5113
E-mail: herbwp@aol.com
Dr. Sher Paul Singh
School of Packaging
Michigan State University
East Lansing, MI 48824-1223
Tel: (517) 355-7614
Fax: (517) 353-8999
E-mail: 22203SPS@msu.edu
Web: http://www.pkg.msu.edu/
Thomas Trost
Packforsk
P.O. Box 9
S-164 93 Kista-Stockholm
Sweden
Tel: (+46) 8-752-57-00
Fax: (+46) 8-751-38-89
E-mail: thomas.trost@packforsk.se
Web: http://www.packforsk.se
Recording Equipment
Several companies have developed self-contained instruments which measure drop heights, shock levels, temperature and humidity. Currently (1996), two companies are considered the technological leaders. They can be reached for current product information at:
Instrumented Sensor Technology, Inc.
4704 Moore Street
Okemos, MI 48864
Phone: 517-349-8487
FAX: 517-349-8469
E-mail: info@isthq.com
Web: http://www.isthq.com/
Lansmont Corporation
Ryan Ranch Research Park
17 Mandeville Court
Monterey, CA 93940-5739
Phone: 408-655-6600
FAX: 408-655-6606
E-mail: lansmont@industry.net
Web: http://www.industry.net/lansmont